TL;DR: I built a self-hosted BI platform where you just type a question and get an answer. It connects to your Azure SQL Database, writes and runs queries on its own, and throws up charts when they make sense. Data from other sources like Exact Online or Shopify can be ingested, and if needed I can connect it to pretty much any relational database. Runs on Docker, costs almost nothing, deploys in minutes. I’m looking for companies willing to test it on their own data. Read on if that’s you.
The Honest Problem
I’ve spent 14 years building BI solutions. First for big multinationals where everything goes through architecture boards and six-month implementation cycles. Then for Dutch SMBs, wholesalers, and retailers where the budget is smaller and the patience is shorter. I know how things are built properly. But I also know that smaller businesses sometimes just need something that works.
The pattern is always the same. A sales manager wants to know which customers are ordering less this quarter. Simple question. But the answer lives in Exact Online, Shopify, or some SQL database, behind a dashboard that doesn’t exist yet. So they email someone, that person writes SQL or builds a report, and three days later the sales manager gets a CSV they don’t fully understand.
Or worse: I build them a €30k dashboard suite, and six months later they’re still exporting to Excel because the dashboards don’t answer the one question they actually had that morning.
BI tools like Power BI help, but they require someone to pre-build every view. If your question doesn’t fit an existing dashboard, you’re back to waiting.
I wanted something brutally simple: type a question, get an answer. No dashboards to pre-build. No SQL knowledge required. No three-day turnaround.
What It Actually Does
You Ask, It Answers
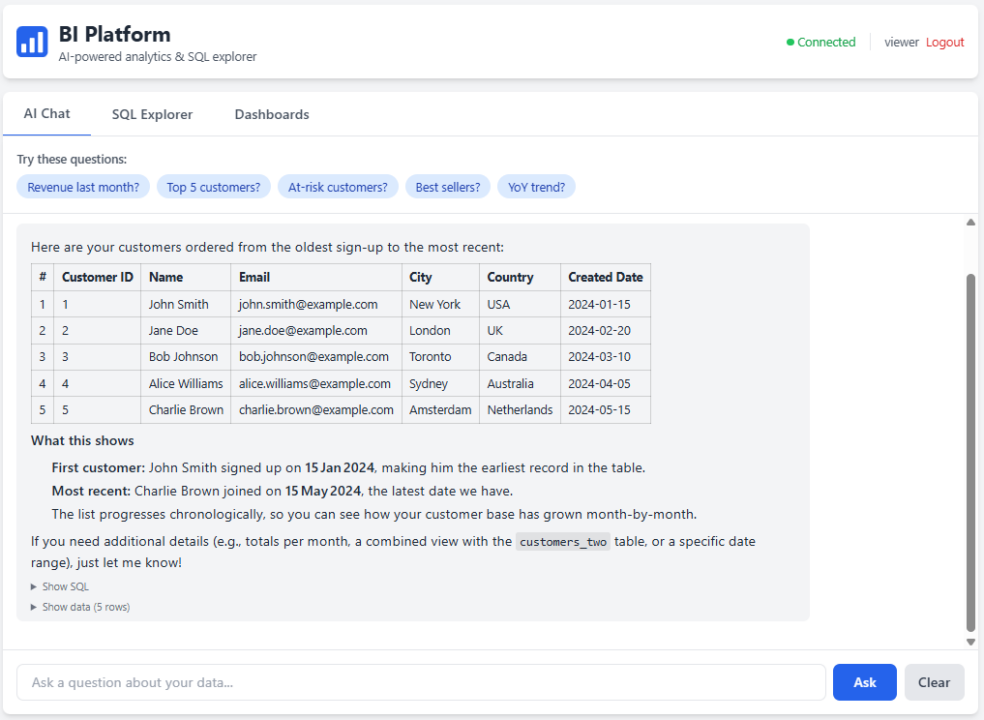
The core is a chat interface. You type normal questions:
- “What were our top 10 customers by revenue last quarter?”
- “Show me the monthly trend of new customer signups”
- “Which products have declining margins compared to last year?”
Behind the scenes, the AI reads your database schema, writes the SQL, executes it, and explains the results in plain language. If it needs multiple queries to answer your question, it chains them together on its own.
It keeps context within a conversation too. Ask “How many orders last month?” and then follow up with “Break that down by product category” and it remembers what you were talking about.
Charts That Just Appear
When the data makes sense as a chart, one shows up. Revenue over time gets a line chart. Sales by region gets bars. Distribution across a handful of categories gets a pie chart.
No configuration. No dragging fields onto axes. The system looks at the actual data shape, not column names, and picks the right visualization.
SQL Explorer for the Power Users
For the people on your team who do know SQL, there’s a full query editor with a schema browser, keyboard shortcuts, sortable results, and CSV export. Because sometimes you just want to write the query yourself.
Architecture: Boring on Purpose
Browser → Nginx → FastAPI → AI Provider (Claude or Groq)
                          → Azure SQL Database
Four components. No Redis, no Celery, no message queues, no Kubernetes. The frontend is a single HTML file. The backend is a handful of Python files.
This isn’t cutting corners. It’s a deliberate choice. Every component you add is a component that can break at 2 AM when you’re not watching. For an internal tool serving a team of 5-50 people, simplicity beats architecture astronautics every time.
| Component | Choice | Why |
|---|---|---|
| Backend | FastAPI (Python) | Async, auto-generates API docs, plays nice with AI SDKs |
| AI | Claude (Anthropic) or Groq | Swappable. Claude for complex reasoning, Groq for speed |
| Database | Azure SQL Database (other relational DBs on request) | Built for Azure SQL. Data from Exact Online, Shopify, and other sources can be ingested. Can be adjusted to any relational database if needed. |
| Frontend | Single HTML + Tailwind CSS + Chart.js | Zero build step. No node_modules. Changes deploy instantly. |
| Proxy | Nginx | SSL, static files, battle-tested |
| Deployment | Docker Compose | One command. Done. |
How the AI Part Works (No Magic)
Let’s walk through what happens when you ask “What’s our average order value by country?”:
- The AI receives your question plus the full database schema (table names, column names, data types)
- It writes SQL:
SELECT country, AVG(order_total) as avg_order_value FROM orders GROUP BY country ORDER BY avg_order_value DESC - The backend executes that against your real database
- Results come back as JSON
- The AI reads the results and writes a human-readable summary
- The frontend renders the explanation and an auto-detected chart
Steps 2-5 can loop multiple times in one turn. If the AI needs to explore first (checking what columns exist, sampling values) it chains queries before answering. It’s autonomous, not a one-shot prompt.
Two AI Providers, One Switch
It supports both Anthropic (Claude) and Groq, switchable with one environment variable:
AI_PROVIDER=groqIn practice: Groq handles 90% of daily questions with near-instant responses. For complex multi-step analytical questions, Claude produces more reliable results. You pick what fits your use case and budget.
What I Learned Building This
Tell the AI What Your Frontend Can Do
My first version had the AI drawing ASCII bar charts in its responses. It didn’t know a real charting library existed on the other side. Fix: explicit instructions in the system prompt saying the frontend handles visualization. The AI doesn’t know about your UI unless you tell it.
Chart Detection Should Look at Data, Not Column Names
First attempt: matching column names against keywords like “revenue” or “count.” Broke immediately on Dutch column names and any non-standard naming. The fix: classify by actual data type (numeric vs. categorical) and data shape. Works regardless of language or naming conventions. That matters when you’re working with Dutch ERP systems.
AI Tool Calls Can Come in Parallel
Claude sometimes fires multiple tool calls at once, querying two tables simultaneously. If your code only handles the first one, you get cryptic API errors. Every tool call needs a corresponding result. Learned that one the hard way.
One HTML File Beats a React App (For This)
The frontend is one HTML file. No build step, no npm, no webpack. Tailwind and Chart.js from CDNs, vanilla JavaScript.
Sounds unprofessional until you realize that for an internal tool with a handful of users, the React tax (build pipeline, dependency management, version conflicts, bundle optimization) buys you nothing but complexity.
Data Privacy: The Elephant in the Room
Since this queries real business data, this matters. Especially for European companies.
Here’s how it works: you bring your own API keys. That means your data flows directly from your infrastructure to your AI provider under your own agreement. I’m not a middleman. The AI only sees query results and schema metadata, not your raw database. No data is stored by the AI provider for training.
Currently, both Anthropic and Groq process data in the US. Groq provides a Data Processing Addendum with EU Standard Contractual Clauses. For many European companies, that’s enough. For others, “data processed in the US” is a hard stop. I get it.
A future version will support EU-hosted AI models to keep everything within European borders. That’s on the roadmap as a requirement, not a nice-to-have.
Either way, reach out if you want to understand the exact data flow. I’ll walk you through it. No sugarcoating.
Deployment: Two Minutes, Not Two Sprints
cp .env.example .env    # Add your credentials
docker-compose up -d    # That's it
I run mine on a single Azure VM (~€15/month) with Nginx handling SSL via Let’s Encrypt. Total cost: one small VM plus AI API usage. No enterprise licensing, no per-seat fees.
What’s Next
This is a focused tool that does one thing well: let people ask questions about their data without writing SQL or waiting for someone to build a dashboard.
On the roadmap:
- EU-hosted AI for full GDPR compliance, no data leaving Europe
- Saved queries to bookmark questions and their SQL
- Scheduled reports that run a question daily and email results
- Azure AD / SSO for proper authentication in enterprise use
Looking for 5 Founding Customers
I’m looking for 5 companies to be the first to use this on real business data. Especially Dutch SMBs, wholesalers, and retailers.
What you get:
- I set it up on your data. Azure SQL Database, or another source. I handle the connection and ingestion.
- Your team gets full access for a pilot period to ask questions, test the limits, and see if it actually saves time.
- A steep discount on the license compared to what it will cost once I launch publicly.
What I get:
- Honest feedback on what works and what doesn’t.
- Permission to use your experience as a case study (anonymized if you prefer).
This is a real product with a real price. The founding customer deal is my way of rewarding the companies willing to get in early and help shape it.
3 of 5 spots are still open. If you’re interested, reach out. I’ll walk you through the setup, show you what it can and can’t do, and you decide if it’s worth your time. No cherry-picked demos.
Wesley van der Ploeg | LinkedIn